

Frequently asked question: “Jean-François, what do you think is the best tool for data analysis?”
My answer: “Tell me, do you know what pivot tables are?”
Their answer is often: “No.” or “Nyyyyyes…” That is why I give them a clear example right away…
Let me explain why pivot tables are so wonderful and relevant!
First of all, you have to know what a pivot table is. It’s simply a table allowing you to group a lot of information in a minimum amount of space. In a few clicks, you can group and organize/aggregate large volumes of data (often digital; like $$$) based on different criteria (categories, time, etc.).
For example, let’s say we have access to a company’s gross sales data. It is often thousands of records including the date, quantity and price of the items for several years. A pivot table then allows you to have a global view of all this information in only a few clicks! For example, here are the changes in the products’ annual sales, per category:
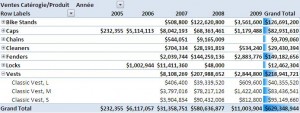
Changes in the products’ annual sales, per category
This often unfamiliar tool is very user-friendly. It is also easily accessible; mostly because it is available with Microsoft Excel. Of course you will first need some data to analyse. It can be stocked directly in Excel or in an external source; like a database or cubes. Speaking of which, I recommend the following article to learn more about cubes: https://www.dev-id.com/en/magic-data-cubes/.
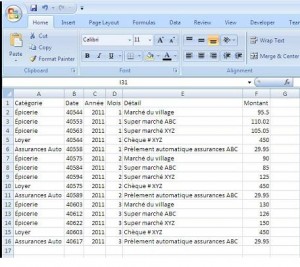
Here are the few steps that will allow you to create your own pivot table in Excel 2007. Let’s take for example the banking transactions of an individual anxious to plan his personal budget:
Copy those transactions in Excel.
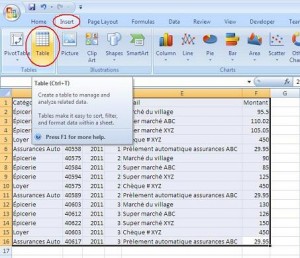
Create a list of objects by selecting the data and then click « Insert » – « Table ».
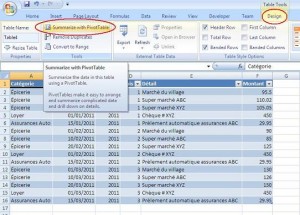
Create a pivot table by selecting a cell of your list and then click « Design » – « Summarize with PivotTable ».
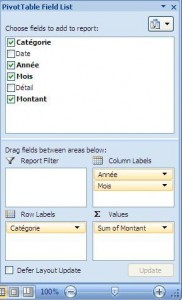
On the right hand side, drag the price in the field named Values, the category in the field called Row and the years/months in the Column field.
And here is the allocation of the expenses!
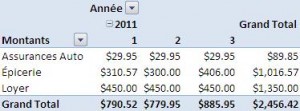
See how you got a basic tool to help you plan your budget only in a few clicks?
This is merely the tip of the iceberg!
Just think how powerful this tool is for analysing complex business situations and identifying new opportunities… With your pivot tables!